Deformation assessment & infrastructure monitoring
An accurate assessment of surface or structural deformation — subsidence or uplift — has been the objective of various studies in the field of environmental sciences and engineering geology over the last few decades. It can be caused by various geophysical processes (natural as well as anthropogenic), such as tectonic and volcanic activities, mass movements on unstable slopes, and mining and groundwater pumping, construction-related activities, etc. In each case, a general monitoring and measurement of the deformation is important owing to various environmental, economic and safety considerations. Traditionally, repeated leveling-based methods, and afterwards GPS-based approaches or a combination of both, were used to monitor and measure land deformation in concerned regions. However, leveling and GPS measurements can only be performed locally (for discrete locations), and therefore, they are not suitable for a wide range assessment of land deformation.
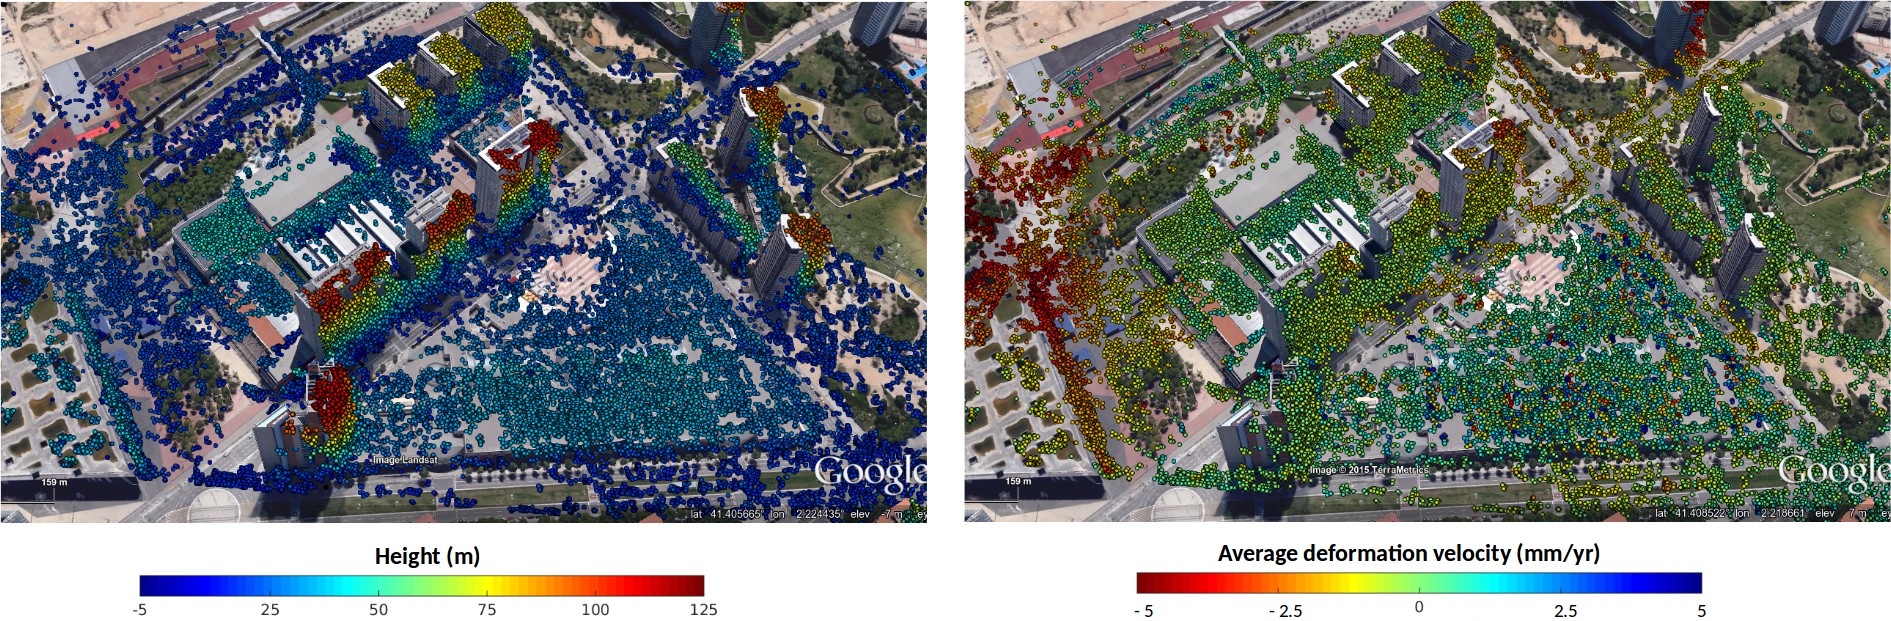
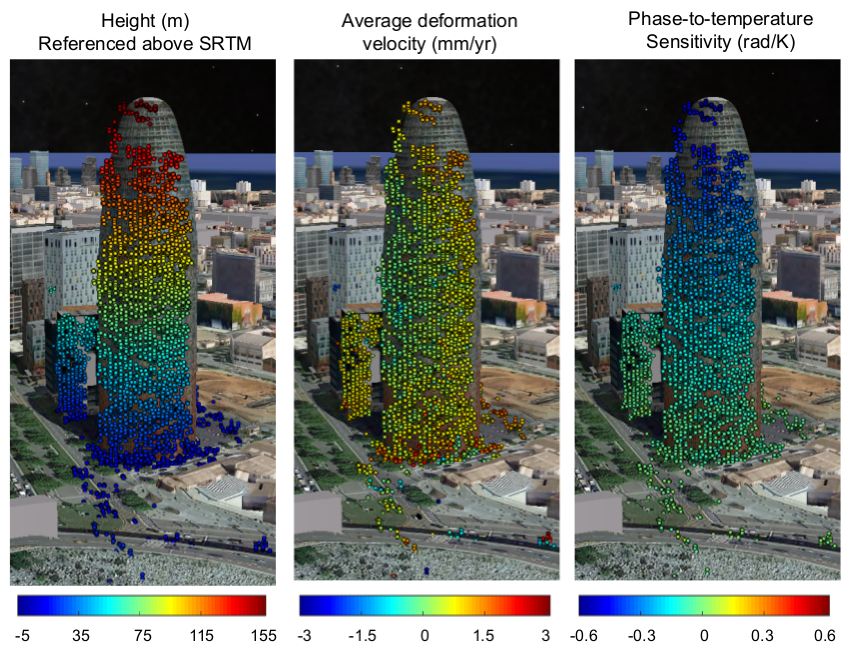
In the context of large-scale and long-term monitoring of deformation in urban areas, PSI with space-borne SAR data stacks has proven to be an invaluable tool. However, an inherent limitation associated with PSI is that, by definition, a PS is a single dominant scatterer within a range–azimuth resolution cell. Therefore, pixels containing backscatter of comparable energy from multiple scatterers, which may individually exhibit point-like behavior, are rejected. This situation arises often in layovers. Urban areas typically have buildings of different heights, and layovers such as those between the ground and the facade of a nearby building, or the rooftop of one building and the facade of a higher building in proximity, occur ubiquitously. A local PSI analysis of such buildings may suffer from poor deformation sampling due to the rejection of such layovers. To overcome this limitation, we investigate the combined use of PSI and tomography.